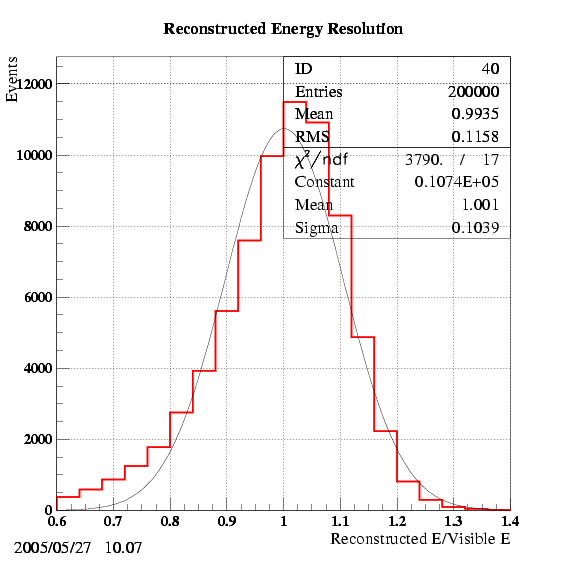
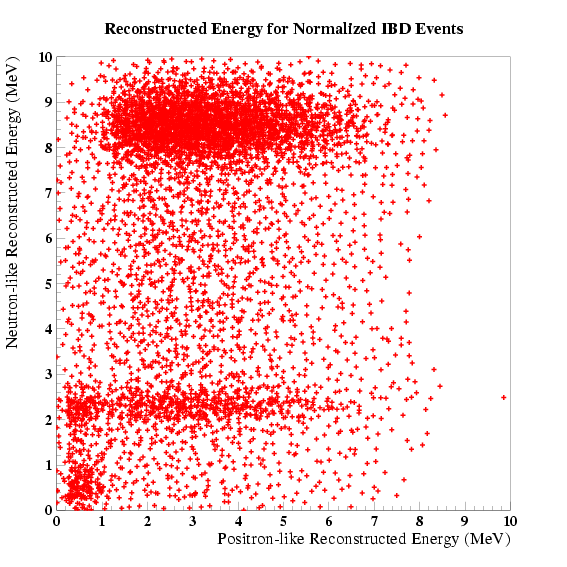
Energy spectra plots
Reconstructions:
- Crude: done at the same time as the PMT information is filled
and uses knowledge of the exact positron and neutron gamma positions to
simulate PMT response. Assumes knowledge of positron and neutron-like
energies. Includes all effects in the NuSAG simulation
document.
- Charge-weighted: done the same way as crude but with a
charge-weighted sum over all PMT to find reconstructed positions for the
positron and neutron gammas. Contains a bug in the charge-weighted sum
where the weighting is only correct for Q > 0 (not correct now that
we allow the pedestal to drive Q negative). Also seems to have a
pathology (maybe bug) associated with adding the Cerenkov light in both
positron and neutron distributions. Assumes knowledge of positron and
neutron-like energies.
- Scope-trace: sums the energy in a time window started by energy
above some threshold (for these plots it is E > 0.2 MeV). No prior
knowledge of the light-generating particle is assumed.
Recommendation: show the scope-trace recon plots. They are consistent
with NuSAG simulation report plots and discussion. They are understood
events (no known pathologies) with established code. Re-do Erin's
acceptance study with these distributions.
Spectra Plots:
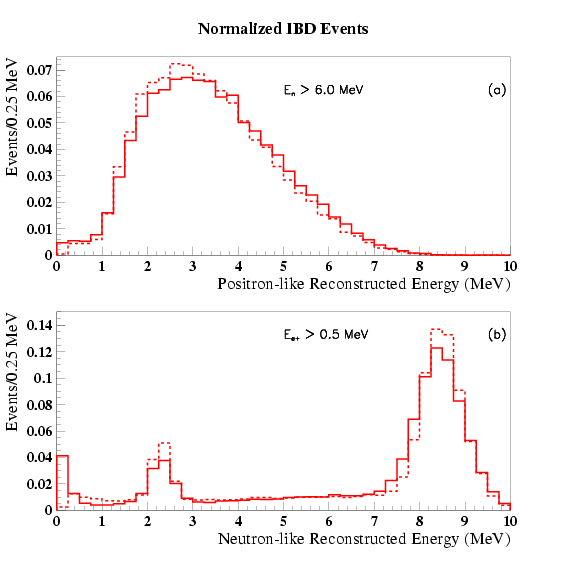
Figure 1: (a) reconstructed positron energy for crude (solid) and
scope-trace (dashed) recons. (b) reconstructed neutron energy for for
crude (solid) and scope-trace (dashed) recons. Only energy cuts are
made for all curves (no timing or position cuts). The dashed curves
have a 0.2 MeV threshold to detect a neutron or positron.
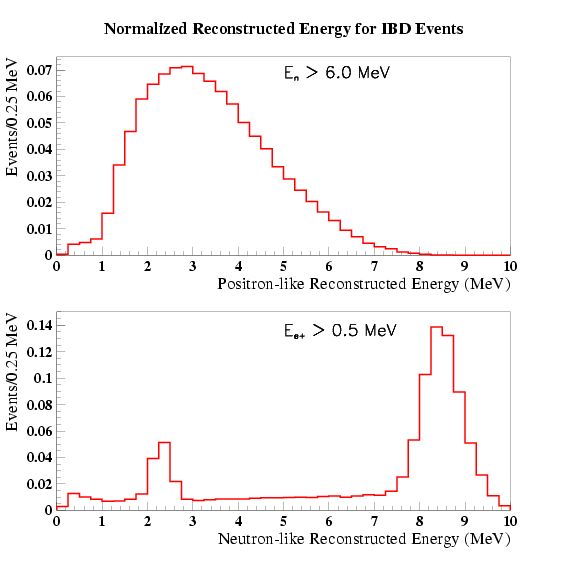
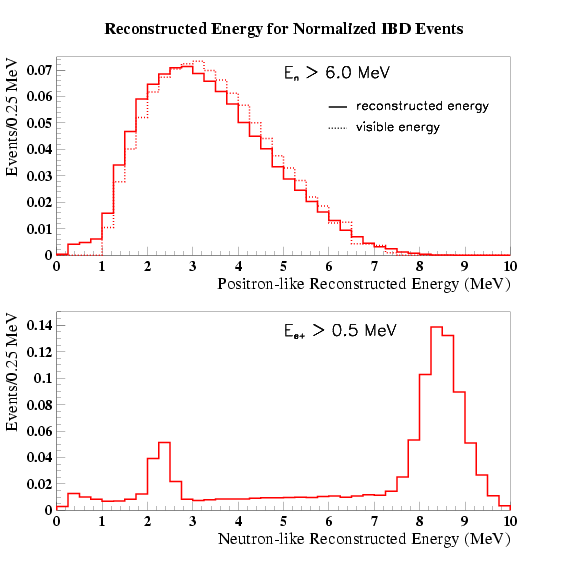
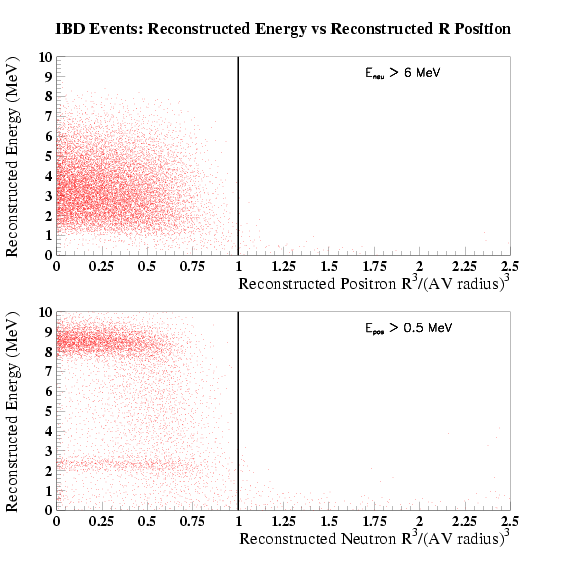
Figure 2: plots for NuSAG using the scope-trace reconstruction.
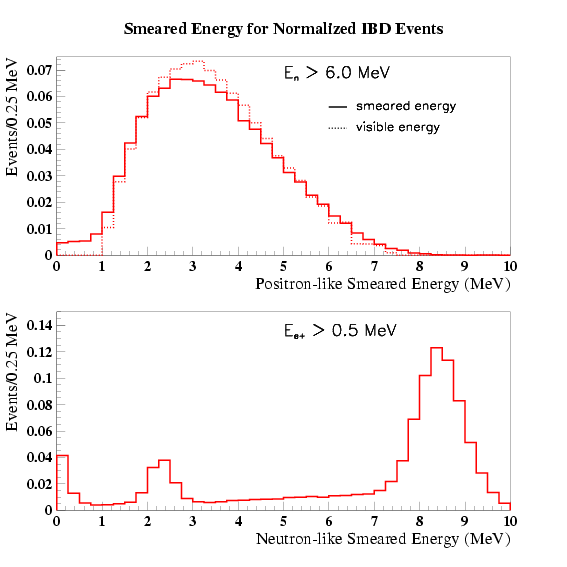
Followup plots:
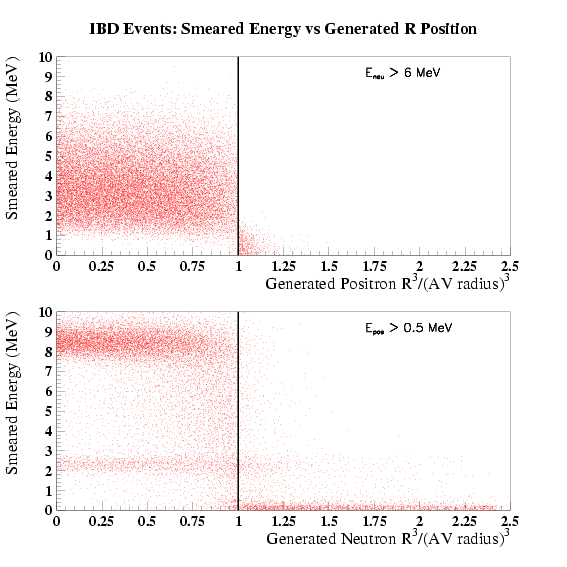
Figures of smeared energy (no position reconstruction) distributions
from the "crude" reconstruction:

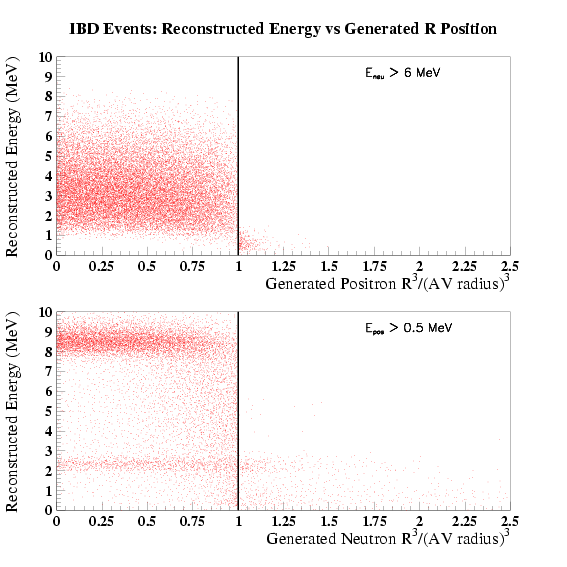
Figures of PMT "scope-trace" reconstructed energy distributions with
a 0.2 MeV threshold:
Supplemental plots:
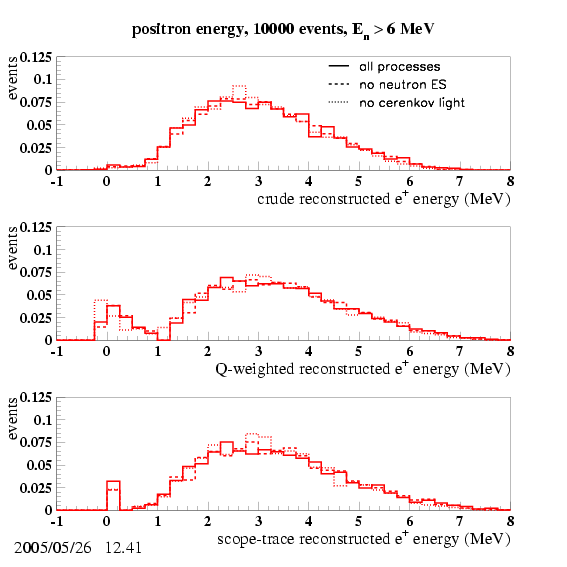
Figure 3: plots of reconstructed positron energy with all effects
(solid), no light from neutron elastic scatter (ES) (dashed), and no
Cerenkov light (dotted) for 10k events with neutron energy cut.
Pathology in low Q-weighted recon at 1 MeV is gone when Cerenkov light
effects removed.
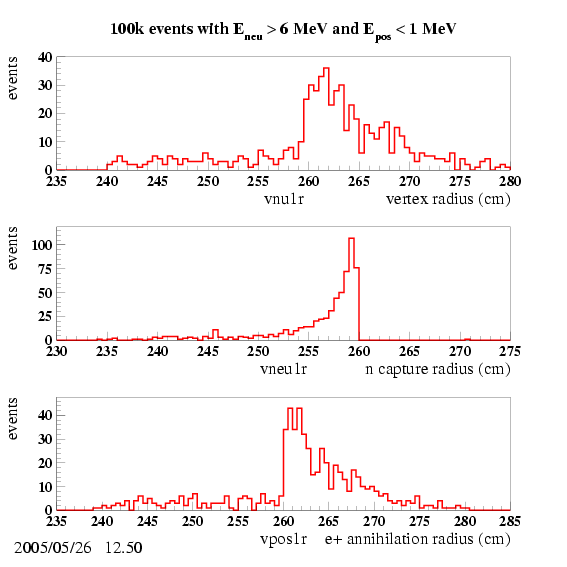
Figure 4: R position for events with neutron capture (En > 6 MeV)
in the low energy positron tail (Ee+ < 1 MeV).
Matthew Worcester
Last
modified: Fri May 27 11:24:55 CDT 2005